Lisa: Dad, don’t you see you’re abusing your power like all vigilantes? I mean, if you’re the police, who will police the police?
Homer: I dunno. Coast Guard?
Recently my Grafana appliance no longer wanted to boot 🙁 (would only go to grub-rescue mode). Fortunately, I was able to spin up a replacement very quickly by following my own instructions I’d written earlier.
This time around though, I thought I should be a bit more prudent and put in some additional safety guards to hopefully ensure that whatever happened, doesn’t happen again. My best guess of what happened last time is that the Grafana appliance itself ran out of space.
I was able to find a nice dashboard of roughly what I wanted here:
https://grafana.com/grafana/dashboards/1443
Along with some basic instructions, but I have modified them slightly to fit my environment.
- Edit your telegraf.conf file: vim /etc/telegraf/telegraf.conf
- Paste the below into the file, and then save quit — :wq
####################################
#My Host metrics for Grafana server#
####################################

[[inputs.net]]
## By default, telegraf gathers stats from any up interface (excluding loopback)
## Setting interfaces will tell it to gather these explicit interfaces,
## regardless of status.
#interfaces = ["eth0,lo"]

[[inputs.cpu]]
## Whether to report per-cpu stats or not
percpu = true
## Whether to report total system cpu stats or not
totalcpu = true
## If true, collect raw CPU time metrics.
collect_cpu_time = false

# Read metrics about disk usage by mount point
[[inputs.disk]]
By default, telegraf gather stats for all mountpoints.
## Setting mountpoints will restrict the stats to the specified mountpoints.
# mount_points = ["/"]
## Ignore some mountpoints by filesystem type. For example (dev)tmpfs (usually
## present on /run, /var/run, /dev/shm or /dev).
ignore_fs = ["tmpfs", "devtmpfs"]
# Read metrics about disk IO by device

[[inputs.diskio]]
## By default, telegraf will gather stats for all devices including
## disk partitions.
Setting devices will restrict the stats to the specified devices.
# devices = ["sda", "sdb"]
## Uncomment the following line if you need disk serial numbers.
# skip_serial_number = false

Get kernel statistics from /proc/stat
[[inputs.kernel]]
# no configuration

Read metrics about memory usage
[[inputs.mem]]
# no configuration

Get the number of processes and group them by status
[[inputs.processes]]
# no configuration

Read metrics about swap memory usage
[[inputs.swap]]
[[inputs.system]]
[[inputs.netstat]]
3. Restart your telegraf service — systemctl restart telegraf
This should now start capturing the local host data into the InfluxDB automatically for you.
4. Create new Dashboard > Import, Load or Paste the .json file available from: https://grafana.com/grafana/dashboards/1443
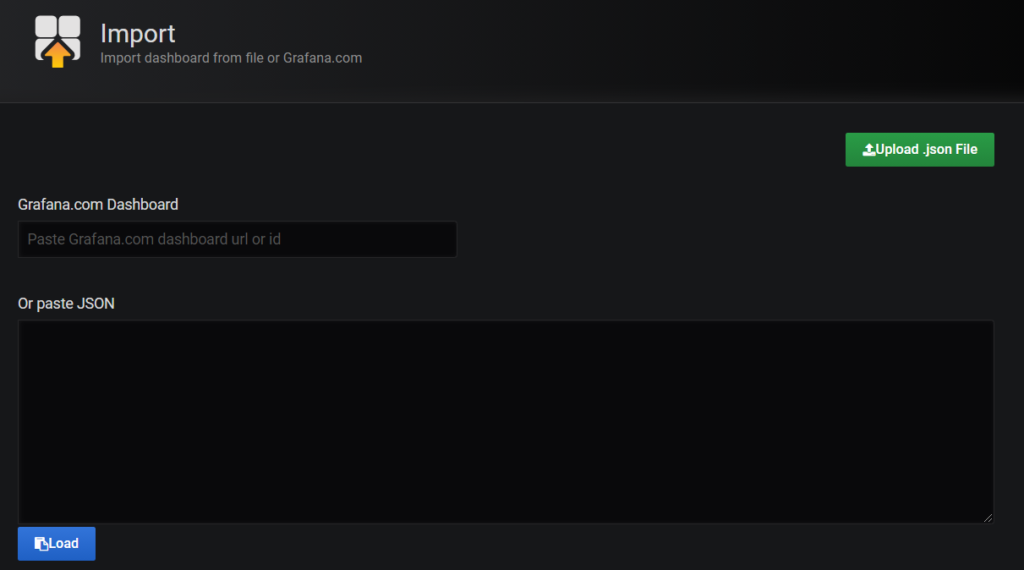
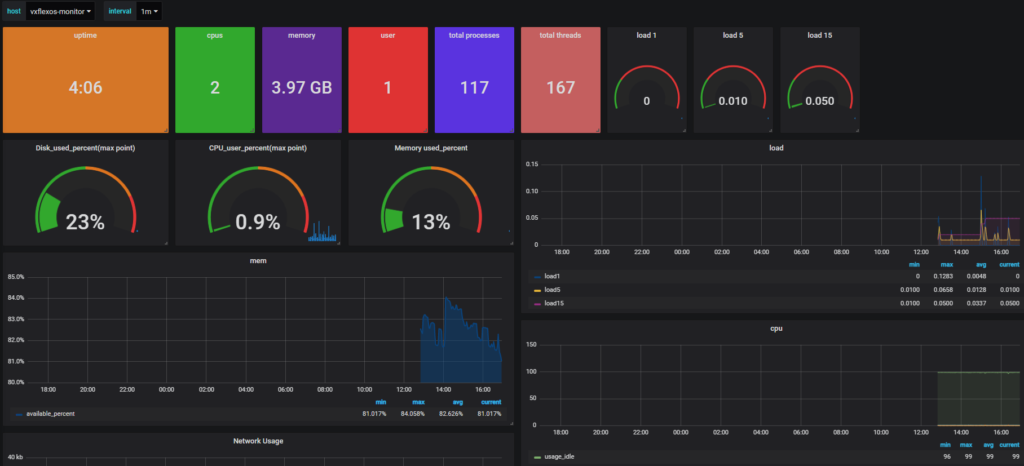
And with any luck, you should be able to start seeing some fresh data in your new Dashboard:
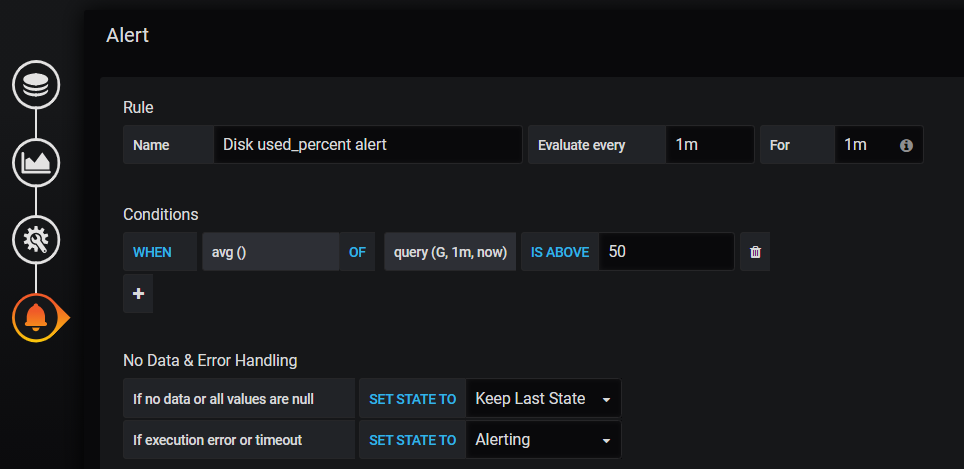
Next steps from you, you will probably also want to setup an email alert for the disk capacity portion. This was a bit trickier as the person that wrote the original dashboard used a slightly odd format (to me) which made modifying it more difficult than usual. To help you out, please try my Dashboard instead below:
You may still need to edit the Alerting section of the new Panel – this is what has worked for me:
If you have any other neat tricks for Grafana, please drop me a line in the comments!


This is excellent!!