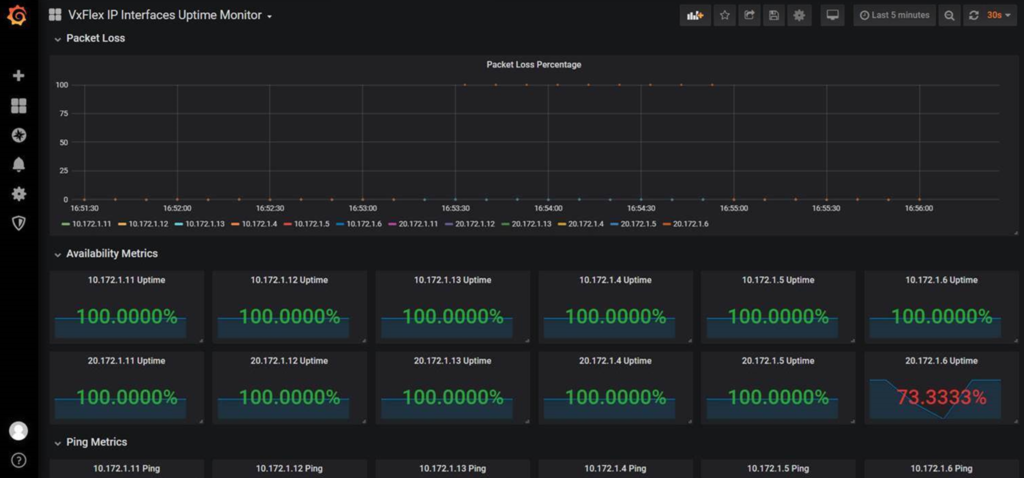
A very good question came in from Nishith about if there is a way to calculate the SLI on PowerFlex clusters. Natively I don’t know of a way within the PowerFlex software itself (possibly with the dial-home / CloudIQ capability, it may provide some metrics back to Dell to show this, but I do not believe this is publicly visible even if it does some form of calculation that way – likely it would be very basic in terms of ‘uptime’ calculation too).
What I have done in the past though is use an extension for Grafana which just a basic ‘ping’ monitoring tool. I feel this would be quite adequate at monitoring the storage-level availability:

What I needed to do:
- Configure my Grafana appliance with 2x additional NICs for the respective networks. To monitor the clients, ping the SDC IP’s – to monitor the SDS level, ping the SDS IP addresses.
- Edit the /etc/telegraf/telegraf.conf file and change the following:
# # Ping given url(s) and return statistics
[[inputs.ping]]
#   ## List of urls to ping
urls = ["10.172.1.11", "10.172.1.12", "10.172.1.13", "10.172.1.4", "10.172.1.5", "10.172.1.6", "20.172.1.11", "20.172.1.12", "20.172.1.13", "20.172.1.4", "20.172.1.5", "20.172.1.6"]
#
#   ## Number of pings to send per collection (ping -c <COUNT>)
count = 1
#
#   ## Interval, in s, at which to ping. 0 == default (ping -i <PING_INTERVAL>)
#   ## Not available in Windows.
ping_interval = 1.0

#   ## Per-ping timeout, in s. 0 == no timeout (ping -W <TIMEOUT>)
timeout = 1.0
#
#   ## Total-ping deadline, in s. 0 == no deadline (ping -w <DEADLINE>)
deadline = 10
#
#   ## Interface or source address to send ping from (ping -I <INTERFACE/SRC_ADDR>)
#   ## on Darwin and Freebsd only source address possible: (ping -S <SRC_ADDR>)
interface = ""
#
#   ## Specify the ping executable binary, default is "ping"
binary = "ping"
- Restart the telegraf service. (Actually not sure if I needed this step, but I did it anyway).
- systemctl restart telegraf
- Within Grafana, import a new Dashboard, and import Dashboard 2960:
Anyway hope that helps Nishith!

