Ever wished you could drill down back to any point in time on your PowerFlex / VxFlex / ScaleIO cluster? Then please read on!
Using nothing but Open Source tools and the native REST API functionality of PowerFlex, you can unlock a tremendous amount of visibility into your environment:
- Capacity utilisation – free space, thin, thick, compression
- IOPS / BW / latency metrics
- Rebuilds / Rebalances
- Different views for the components, SDS, SDC, Volumes, etc.
- Extensible – add-on email alert triggers, ping monitoring, and so on.
Enough talk though, please download the the virtual appliance and documentation here: https://1drv.ms/f/s!AmWHx24GTF-cuAmMHOEqt_O4eXAq?e=peKcNk or https://grafana.powerflex.me (redirect) – It’s a very straight forward setup which should take you less than 1 hour in total. (A big shout out to Brian Dean for making this so simple).
If you do get stuck with anything, or have any other wish list items, please do let us know on the comments section of this blog below.
Email Alerting:
Proper monitoring is critical to the success of any system, and PowerFlex is no exception in this regards. With the email alerting functionality in Grafana, it’s easy to setup critical thresholds that will trigger depending on what you need to see.
Setup Instructions:

1. Edit the grafana.ini file:

[root@vxflexos-monitor ~]# vim /etc/grafana/grafana.ini

2. Search for the SMTP section:

/smtp

3. Edit this section of the file according to your environment:

######## SMTP / Emailing ########

[smtp]
enabled = true
host = your.mail.server:25
;user =
;# If the password contains # or ; you have to wrap it with trippel quotes. Ex """#password;"""
;password =
;cert_file =
;key_file =
skip_verify = true
from_address = your.email@company.com
from_name = Grafana PowerFlex Production
EHLO identity in SMTP dialog (defaults to instance_name)
ehlo_identity = grafana.company.com
[emails]
welcome_email_on_sign_up = true

4. Save the file (Escape, :wq)

5. Restart the grafana server:

[root@vxflexos-monitor ~]# systemctl restart grafana-server

6. If you ever need to see the traffic hitting your email server for troubleshooting, use this string in tcpdump (you will need to install tcpdump first, 'yum install tcpdump':

[root@vxflexos-monitor ~]# tcpdump -vv -x -X -s 1500 -i eth0 'port 25'

7. As another test you can / should also verify that you can send an email directly to your mail server via telnet (yum install telnet) - There is a good guide on this here.
Jump back into your Grafana web console, and go to the Alerting section:
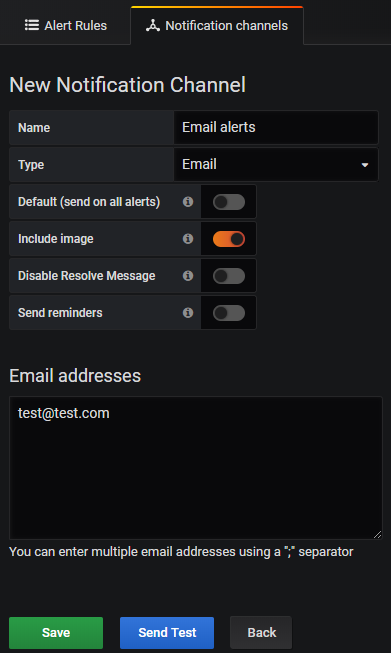
Next, setup a new Notification channel and your email address(es):
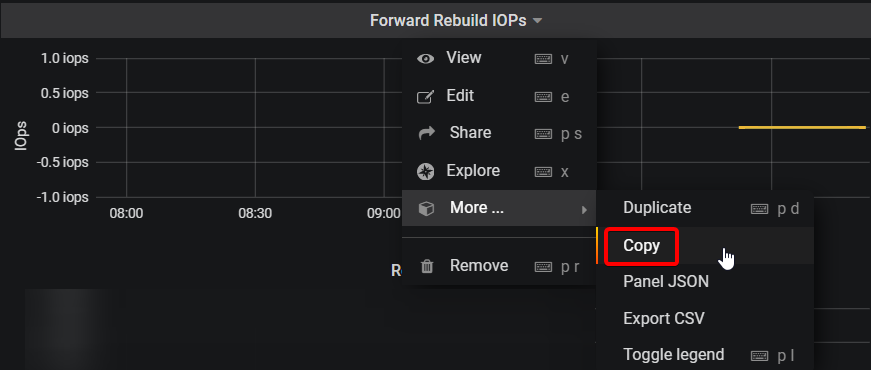
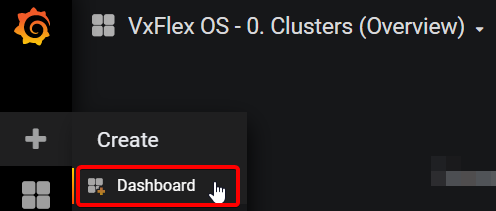
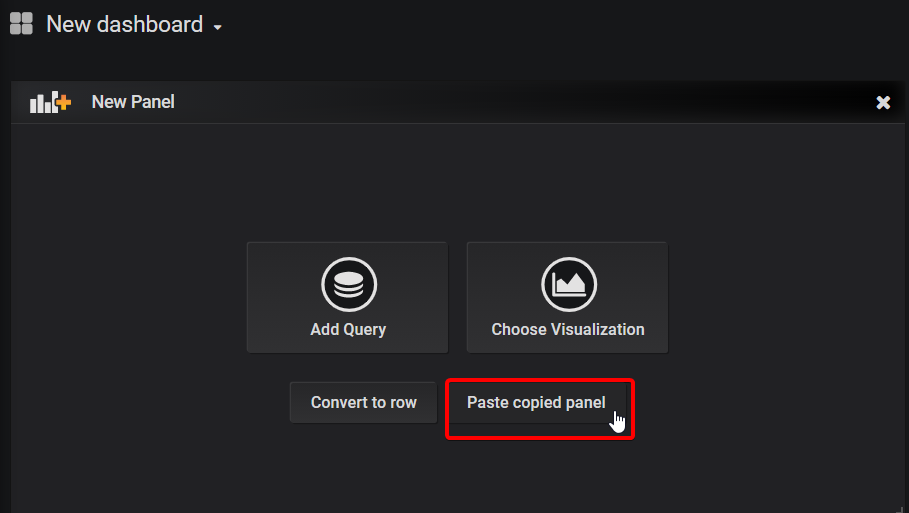
Copy any table into a new Dashboard:
And then remove the variable (Grafana alerts do not like variables):
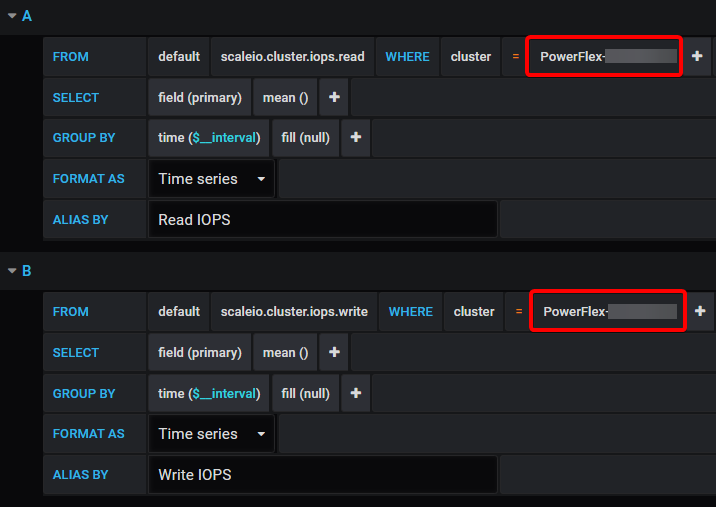
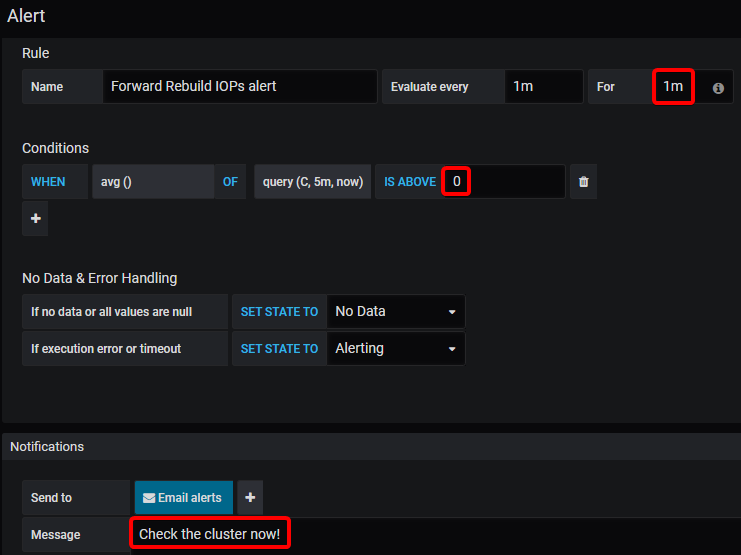
Next set your alert. In the below example I have set it to send an alert if the Read or Write IOPS exceed 5000 for more than 5 minutes.

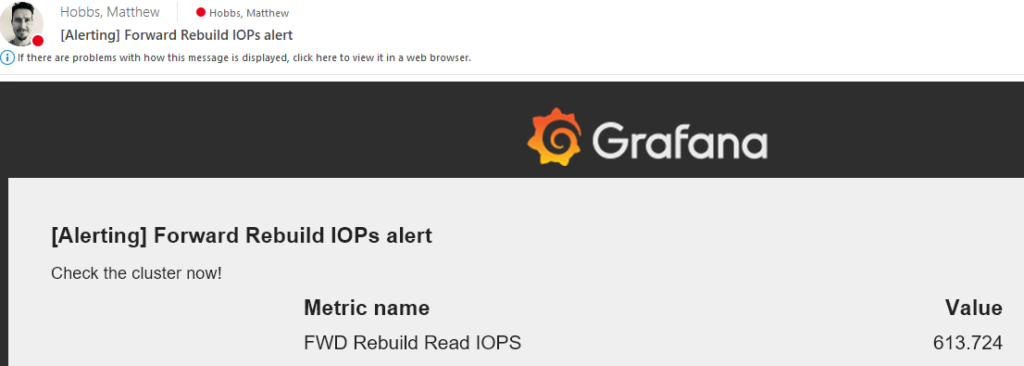
Probably a more useful one, is to be alerted if any forward rebuilds are occurring:
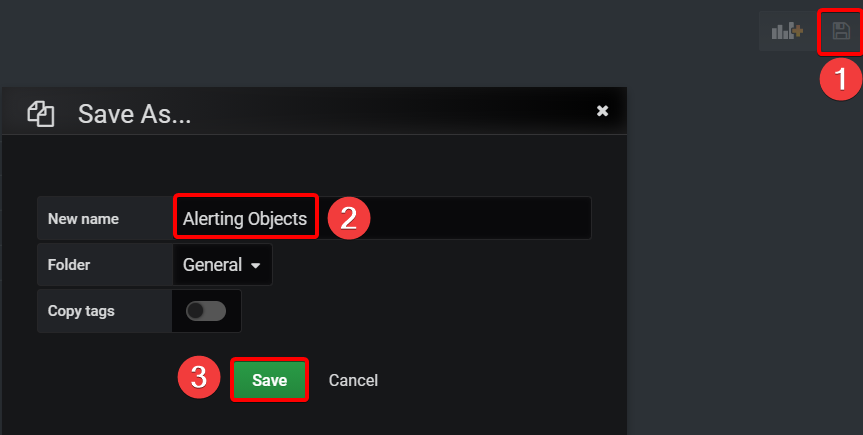
Do also remember to Save your new dashboard!
While this email alerting functionality is very handy – It should also be setup in conjunction with ESRS, syslog and SNMP traps that PowerFlex also supports. You should also periodically verify that your alerting system is working correctly.
Log Retention Period
By default, the Grafana appliance has an indefinite retention period – meaning that eventually you’ll either need to increase the disk space or simply run out of it!
So first things first, you can check how much space your current DB is using:
[root@vxflexos-monitor ~]# du -sh /var/lib/influxdb/data/telegraf/
1.5G    /var/lib/influxdb/data/telegraf/
Based on this, you can estimate how much time has passed since you began logging and the size of the DB to determine how much capacity you might need in the future.
Next, if you know that you will not need data after ‘x’ amount of time, you can configure InfluxDB to drop that older data:
[root@vxflexos-monitor ~]# influx
Connected to http://localhost:8086 version 1.7.6
InfluxDB shell version: 1.7.6
Enter an InfluxQL query
> use telegraf
Using database telegraf
> show retention policies
name    duration shardGroupDuration replicaN default
----    -------- ------------------ -------- -------
autogen 0s       168h0m0s           1        true
> ALTER RETENTION POLICY “autogen” on “telegraf” DURATION 52w
> show retention policies
name    duration  shardGroupDuration replicaN default
----    --------  ------------------ -------- -------
autogen 8736h0m0s 168h0m0s           1        true
> exit
There are other tricks like down-sampling the data too to keep less information — but I haven’t tried that myself yet:
Clearing Influx DB
If you’ve got yourself into a situation where you want to wipe your Influx DB and start your metrics from scratch:
[root@vxflexos-monitor telegraf-vxflex]# influx
> use telegraf
> DROP SERIES FROM /.*/
> exit
[root@vxflexos-monitor telegraf-vxflex]# reboot
Do let us know in the comments section how you get on with this and what other monitoring features you’d like to see in your PowerFlex environment.

I am getting the following error after upgrading to PowerFlex 3.5. Would you have any ideas?
telegraf[1309]: 2021-04-29T13:21:00Z E! [inputs.exec] Error in plugin: metric parse error: expected field at 1:35: “{\”message\”:\”StoragePool properties<– here"
Hi Rex, which version of the grafana appliance are you using? The current version is 3.2, and the previous version was 3.0a.
There was a note in 3.0a about PowerFlex 3.5:
If users upgrade a monitored system to VxFlex OS version 3.5, an system metric that we query has ben removed from the API.
Therefore the query set will fail, and prevent further monitoring.
Although we have pulled down this metric, it is not used in any dashboards.
Users upgrading to version 3.5 should remove this from querySelectedStatistics.json
* Open /var/local/telegraf-vxflex/querySelectedStatistics.json
* Navigate to the StoragePool types and delete the line with “checksumCapacityInKb,”.
* Save and close your editor and the tools will begin pulling all of the metrics down again.
Matt,
I deleted that line an now everything is working great. Thanks for your help and keep up the good work. I love your site.
Hi Matt,
Where I can download the latest version & the technical guide.
Thank you
Hi Jeff, you can always grab the current version here.
Can we club this grafana deployment to help us show K8s cluster pod stats too ?
Can we add PFMP 4.0 to this as there is no Gateway anymore?
Hi Dipak, I’ve been told from others that it still works with version 4.0. The gateway / REST API is now built directly into PowerFlex Manager, so you just need for it to query the PFMP IP address. The legacy API’s are all still there, so it should be business as usual.
Hello,
The link is not working. Does the process work on 3.6 too?
https://1drv.ms/f/s!AmWHx24GTF-cuAl5Y8hESDk5YEQm
You will need to have your own Microsoft account to see the files, but it’s working.
Is there any method to check “consumed capaity” of volume? there is no info in query volume and cant find in rest api
If the Volume is thin-provisioned, then you should be able to see this. For thick-provisioned, then it’s not possible and could only be done within the operating system that it’s attached to.
For Thin Volumes:
[root@pf01-mdm01 ~]# scli –query_volume –volume_id 7a3754a100000011
>> Volume ID: 7a3754a100000011 Name: powerflex-service-vol-1
Provisioning: Thin
Size: 16.0 GB (16384 MB)
Total base user data: 776.0 MB (794624 KB)
That Total base user data is what you’re after.
When using Grafana to monitor PowerFlex I see that some volumes update every 10 seconds (which is great), but then other volumes update every 60 seconds (not so great). These volumes are all getting pulled from the same Gateway, so not sure why.
Any ideas?
Looks like I found my issue. I noticed the following in the messages log and increased the metric_buffer_limit value until it cleared.
Metric buffer overflow; 11324 metrics have been dropped
Hi Matt, the appliance works great, I would like to take it a step further and calculate SLI of my powerflex storage setup. Does the telegraf collects any metrics that can indicate powerflex host availability as seen by the storage?
Hi Nishith – excellent question – I’ve made an unlisted blog post to hopefully address this for you: https://powerflex.me/2023/01/23/powerflex-grafana-sli-extension/
hi Matt. I was overwhelmed at first when I saw you called out my name in your Blog Post, Thank you.
Your solution works, but I have a requirement which forces me to dig slightly deeper, Like an SDS state transitions, For example
– SDS Connection State( As seen by Powerflex MDMs)
– SDS Maintenance Mode (It is possible to put an SDS into Maintenance, possibly recorded by some metric?)
– SDS Power State (To tell if it is down)
And SLI would be something like ‘SDS maintainence mode’ is 0 and ‘SDS connection state’ (Or Power State’ is 1.
This would actually consider the fact that the hosts can be taken out for maintenance purposefully and may be rebooted as well.
Something similar to what I could obtain for ESXi hosts in Vmware and am intending to use.
But thanks anyway, I may end up lowering the expectation of the customer in their ask and use your solution if I don’t find anything else. 🙂
Is there a way to visualize the metrics that we collect from influxdb?
I saw something like
– sdsState (Normal/RemovePending)
– mdmConnectionState (Connected/Disconnected)
– maintenanceState (NoMaintenance/SetMaintenanceInProgress/InMaintenance/ExitMaintenanceInProgress)
https://developer.dell.com/apis/4008/versions/3.6/PowerFlex_3.6_RESTAPI.v1_149.json/paths/~1api~1instances~1Sds::%7Bid%7D/get
This can help a great deal to calculate the SLI correctly. Can I Include these in anyway in our telegraf configuration?
Hi Nishith,
If there is an API for a certain metric, then yes it’s possible to have them queried and added to the influxdb for use in any type of Grafana chart. If you start to look under the hood, and can find the file “querySelectedStatistics.json” you can modify that to include those other APIs. (You will also need to restart services for it to start receiving the new metrics).
From there you can create your own custom Dashboard in Grafana to lay it out like you have in mind.
If you’re successful in your endeavor here, it would be great if you could share back your modifications – we could then see if it’s possible to include it by default in the next update.
Sure thing Matt, thats the least I can do.
Hi Matt,
Apologies for taking a while to get back to you. I have modified the sdk a little bit to incorporate 4 additional metrices from SDS hosts i.e. –
– mdmConnectionState
– maintenanceState
– membershipState
– sdsState
These metrics can help understand when a SDS host is in maintenance or is connected to mdm (indirectly help getting the SLI for SDS hosts).
I was wondering where can I share the modifications in the sdk and grafana panel in sds dashboard. Pardon my ignorance and please suggest. Maybe it will be useful for others.
Hi Nishith,
Great to hear from you again. If you could please try and share the dashboard at https://grafana.com/grafana/dashboards/ – and let us know the link you create there.
For the SDK modifications, please email it to a@d#m$i%n@powerflex.me (remove the special characters) and it should reach me there. I will then help to share it with the main developer / or post the file here on the site.
Thanks again for your efforts!
Hi Matt,
Does the Historical Reporting Grafana dahboard also work for PowerFlex 4.0.
Thank You
Hi Jack, yes it should also still work for 4.0 and 4.5.
Hi Matt,
Is this onedrive link still valid, I was able to deploy this last year but now I am unable to find the files in that link.
Thank You
Hi Prad, apologies for the delay – another person has also asked me and it seems the link has changed – the new location is: https://1drv.ms/f/s!AmWHx24GTF-cuAmMHOEqt_O4eXAq?e=peKcNk
Thank you Matt, appreciate the help 🙂
Hi Matt,
This link still not working. Can you check again?
Thx!
I’m having some trouble with it too at the moment, seems to loop around until it blocks my request. Let me check this out further.
Any updates here? I have same loop issue, tried multiple accounts, but no luck.
Hi Kalman – correct link is https://1drv.ms/f/s!AmWHx24GTF-cuAmMHOEqt_O4eXAq?e=peKcNk
I got the loop issue, too. Can not see the downloadable files.
Hi Ryan – correct link is https://1drv.ms/f/s!AmWHx24GTF-cuAmMHOEqt_O4eXAq?e=peKcNk
Hi! Matt, nice to hear from you…
great to see that grafana download link is back. I test it , and can be downloaded.
THanks again & great job!
what’s the difference of 3,3 beta vs 3.4 beta?
Is 3,4 stable?
Actually we found lots of issues in pfmp 4.6.x.
The new version was a “cold shower” for our engineers, especially during the upgrade using the 3.6 Powerflex custom node. **sadly**
Appears the download link is not working. Any update on a new location?
Hi Jeremy – if you’re still looking for this the correct URL is: https://1drv.ms/f/s!AmWHx24GTF-cuAmMHOEqt_O4eXAq?e=peKcNk
Hi All, the correct working link is: https://1drv.ms/f/s!AmWHx24GTF-cuAmMHOEqt_O4eXAq?e=peKcNk
The incorrect version has a ‘g’ before the ? whereas the correct one has a ‘q’ — only took a few years to solve it!